
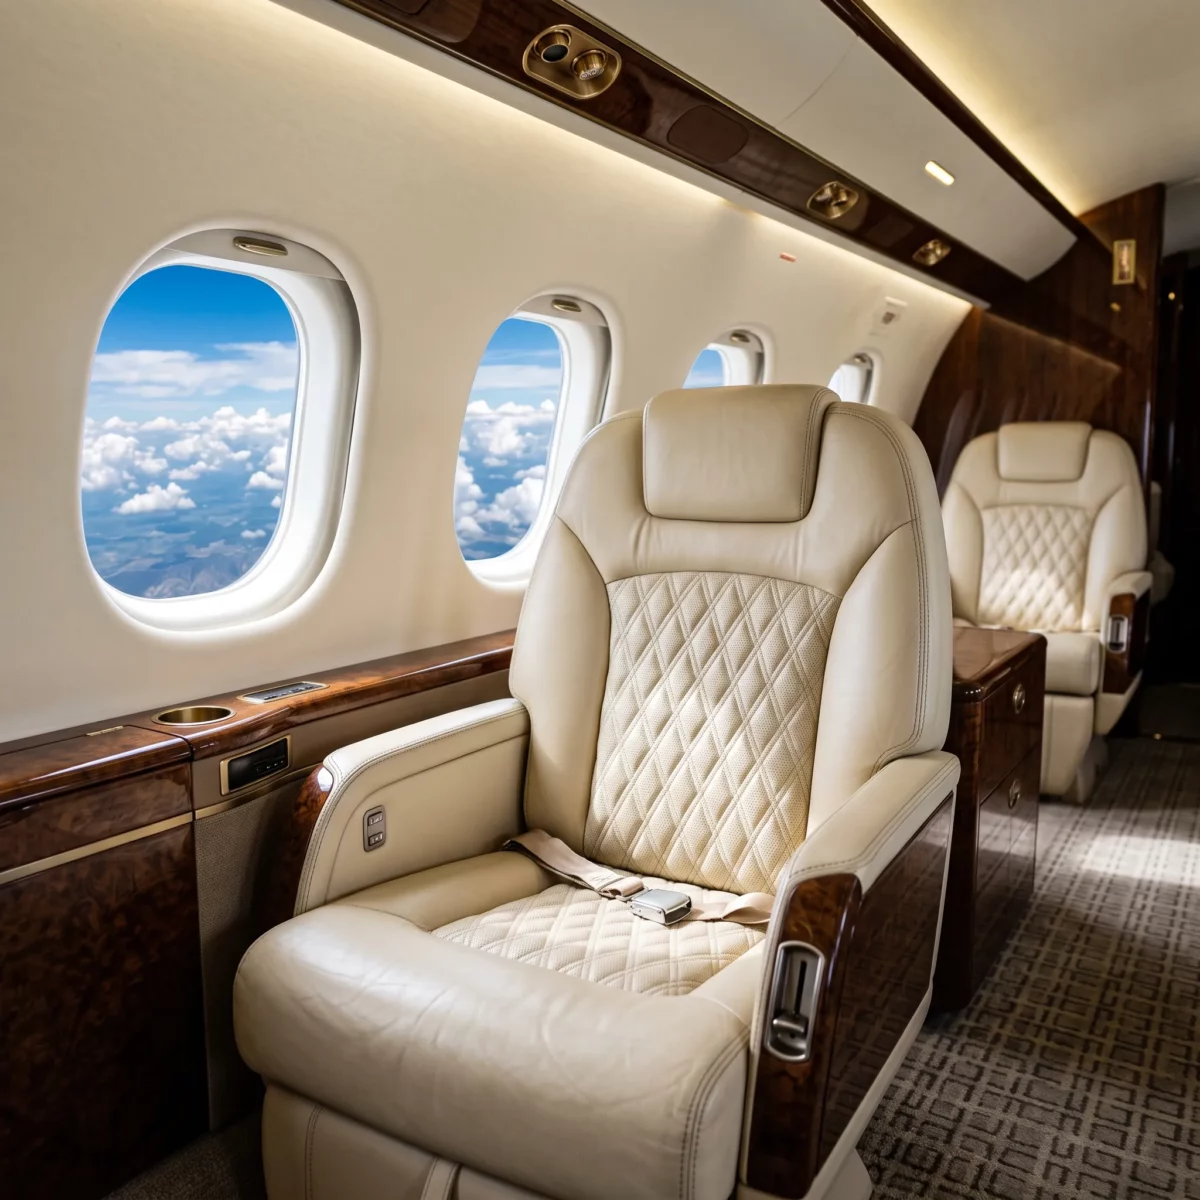
Here’s some good news buried in a mixed bag: jet card hourly rates actually dropped in the second quarter of 2026. Just barely, mind you. A 1% dip to $11,314 per hour won’t change anyone’s budget dramatically. But if you’re planning your fall and holiday travel around a jet card program, the pricing headline isn’t the story that matters most. The real story is what’s happening with peak days, and it’s not great news for anyone hoping to fly on impulse over Thanksgiving or Christmas.
The Pricing Picture Is More Complicated Than It Looks
That modest 1% quarterly decline sits alongside a 0.4% year-over-year increase and a staggering 27.7% jump from pre-pandemic Q4 2019 levels. So while things eased slightly from Q1, we’re still living in a fundamentally more expensive market than the one that existed before 2020. According to Private Jet Card Comparisons, entry-level programs under 50 hours averaged that $11,314 figure, and if you strip out turboprops from the mix, the number climbs to $11,688.
Not every category moved in the same direction. Super Midsize jets were the lone segment to actually get more expensive quarter over quarter, ticking up 0.7% to $12,526 per hour. That matters if you’re the type of flyer who needs the extra cabin space and range a Super Midsize offers for a family ski trip or a transcontinental business run.
Why Rates Softened at All
Part of the dip traces back to market exits rather than genuine price competition. Jetvia eliminated its guaranteed program entirely, while Wheels Up quietly shut down its legacy offering — and Jettly pulled its 25-hour product from the shelf altogether. When providers with certain pricing structures leave the field, the remaining averages shift, sometimes making the market look more favorable than it actually feels to someone shopping for a new card today.
“Averages can be deceiving when the market is contracting,” said one jet card broker who tracks pricing trends closely. “You lose a few outlier programs, and suddenly the number looks better even though the flying experience for most buyers hasn’t gotten any cheaper or easier.”
Peak Days Are the Number You Should Actually Worry About
Here’s where things get interesting, and slightly concerning if you’re planning ahead for the holidays. The average number of peak days, those blackout-adjacent dates when providers can charge premiums, require longer notice, or limit availability, spiked 25.2% in a single quarter. That’s a jump from 36.3 days to 45.4 days.
Zoom out further and the trend looks even more dramatic. Year over year, peak days are up 27.5%. Compared to pre-COVID 2019, when the average sat at just 22.8 days, we’re now looking at a near doubling, a 99.1% increase. Translation: nearly twice as many days on the calendar now carry restrictions or surcharges compared to six years ago.
Why does this matter for your Thanksgiving flight to Aspen or your New Year’s trip to Palm Beach? Peak days cluster around predictable windows — Thanksgiving week, the stretch between Christmas and New Year’s, the Super Bowl. More peak days means less flexibility precisely when you need it most.
- Book earlier: With longer callout requirements often paired with peak periods, waiting until Thanksgiving week to call your provider is a losing strategy.
- Read your contract’s peak day list: Not all programs define peak days the same way. Some run 8-10 blackout-style dates. Others now stretch well beyond that.
- Ask about peak day surcharges upfront: These can add meaningfully to your per-hour cost on exactly the days you’re most likely to fly.
Minimums and Lead Times Tell a Nuanced Story
Minimums and lead times, though, tell a friendlier story. Average daily minimum flight times actually fell 3.4% sequentially, dropping from 96.1 to 92.9 minutes. That’s a small win for owners flying shorter regional hops, since you’re not paying for unused minimum flight time on quick trips. Still, that figure remains 10.9% higher than a year ago, so the relief is modest.
Callout lead times for non-peak days eased slightly too, down 1.5% to 65.9 hours. That’s the advance notice most providers want before a standard flight. It’s a small improvement, though still 4.3% above where it stood a year earlier.

Quick Comparison: Key Metrics, Then and Now
| Metric | Q2 2026 | Pre-COVID (2019) |
|---|---|---|
| Avg. Hourly Rate | $11,314 | ~$8,860 |
| Avg. Peak Days | 45.4 days | 22.8 days |
| Super Midsize Hourly Rate | $12,526 | ~$9,750 |
What This Means for Your Fall and Holiday Planning
If you’re holding a jet card or shopping for one before the holiday rush, the smart move is to stop fixating on the hourly rate alone. A slightly lower rate doesn’t help much if you can’t get a jet when you actually want one, or if you’re stuck paying peak surcharges on top of that rate anyway.
Talk to your provider now about how their peak day calendar looks for November and December. Ask specifically how many peak days fall within your likely travel windows. If the number feels high, or the callout lead time feels aggressive, that’s worth factoring into whether you renew with your current program or shop elsewhere before contracts lock in for next year.
The consolidation happening in the jet card market, with providers like Jetvia and Wheels Up stepping back from guaranteed programs, suggests the field is settling into a smaller group of operators with more consistent terms — but don’t expect much wiggle room when you call to negotiate peak-day exceptions.
Call your provider this week and ask for the peak-day calendar in writing, not a verbal assurance. That’s the only number that will actually matter on December 23rd.